

A sales VP sits in a Q4 pipeline review, looking at dashboards that show a healthy pipeline. Later, the leadership team finds out only half the projected revenue lands. What might have happened?
One guess: The team was tracking the wrong metrics.
Let’s explore predictive sales pipeline metrics, so your team can get un-stuck from retrospective reporting methods. When you shift your focus to forward-looking indicators, you’ll empower your sales organization to make better decisions and drive consistent results.
Key takeaways from this article:
- Track predictive sales pipeline metrics that predict revenue, like opportunity-to-close rate and deal velocity, instead of relying on vanity metrics that don’t forecast revenue accurately.
- Focus on actionable, stage-specific insights and maintain data to spot blockers, coach your reps, and adjust strategy before problems impact your bottom line.
- Use visual collaboration tools like Mural to review, analyze, and act on your pipeline data as a team, ensuring transparency, proactive selling, and a reliable revenue forecast.
What are sales pipeline metrics?
Put simply, sales pipeline metrics are measurable data points that track the progress and health of your sales opportunities. As deals move through different stages of the pipeline, these metrics help sales teams monitor activity, identify blockers, and forecast future revenue.
Gert-Jan Lagas, AVP in Revenue at Mural, emphasizes the importance of looking beyond how full your pipeline is:
"Predictive metrics show you how fast you're moving and whether you're headed in the right direction."
According to Forbes, companies that have accurate sales forecasting are 10% more likely to grow their revenue year over year. By zeroing in on the right metrics, you can confidently guide your team toward sustainable success.
Related: Pipeline management: How to boost sales efficiency and revenue
Why sales pipeline metrics are crucial for forecasting
It can be tough to trust the numbers for revenue prediction in your pipeline. A number of challenges can get in the way of making accurate forecasts. Pay attention to these common pitfalls, like:
- Counting stalled deals as healthy. If 25% of your pipeline hasn’t moved stages in a month, your true pipeline coverage is probably lower than you think. This can undermine effective revenue management.
- Over-relying on top-of-funnel metrics. Total opportunities or pipeline value looks good, but what percentage makes it past the proposal stage? Focus on conversion rates, not just lead counts.
- Ignoring channel-specific differences. Treating all leads or deals the same hides channel performance gaps. Make sure to review conversion rates by source.
- Comfort with average sales cycle. If you only track the overall average, you’ll miss stage-specific slowdowns. Pay attention to where deals get stuck.
- Letting data hygiene slip. Is your CRM up to date? Regularly audit your CRM, and double-check your data along with the accuracy of all next steps, owners, and deal stages.
Knowing how to predict revenue with sales metrics means you can take early action when things go south. These metrics show where you need to intervene now, instead of watching reps scramble at the end of the quarter.
Related: Transforming sales pipeline reviews: A step-by-step guide using Mural
As Gert-Jan reminds us, making sure your data is correct can improve your team outcomes:
"We stopped treating every deal like it was real just because it was in Salesforce. Scrubbing the data is sometimes uncomfortable. But the truth works for us, instead of against us."
The bottom line: Choosing the best sales pipeline metrics for revenue prediction is just one part of the equation. Your team’s process and approach to ensuring transparent reflection, personal accountability, and teamwork matters too. The most successful sales teams are open, challenge the data, and work together to take action week after week.
10 key sales pipeline metrics for accurate revenue prediction
A friendly reminder before we get started: Definitions and formulas may vary from organization to organization. Double-check that your pipeline stages and calculations match your CRM and sales process.
Okay, let’s go! Here are 10 sales metrics to support your data-driven sales strategy and boost the accuracy of your revenue predictions.
1. Opportunity-to-close rate
This metric tells you what percentage of the pipeline your team is turning into revenue. If you started the quarter with 100 opportunities and closed 22, your opportunity-to-close rate is 22%. Easy enough.
Low conversion wastes sales effort. If this number drops, consider refocusing on how you qualify deals and coaching the team on closing skills.
Formula: (Number of closed-won opportunities / Total opportunities) × 100

Tip: Try using Mural as a team to visualize win/loss patterns together. Have your reps mark up reasonings for each outcome on stickies, then use the Affinity Clustering template or Mural AI to find patterns.
2. Pipeline coverage ratio
This ratio compares the value of your open pipeline to what you need to hit your goal. A common goal is to keep this at 3x your target, but you should adjust it depending on your team’s historical close rates. If your goal for the quarter is $100,000, you’ll want at least $300,000 in qualified pipeline opportunities.
Running short means your team risks missing your goal, so if this happens, focus on pipeline building or qualifying stronger deals. Keep a close eye on this ratio to assess overall pipeline health.
Formula: Total pipeline value / target quota

Tip: Try running “what if” exercises: “What if our close rate drops by 10%? What if we upsell 2 extra deals?” Have your team brainstorm different scenarios and see how they impact your goal.
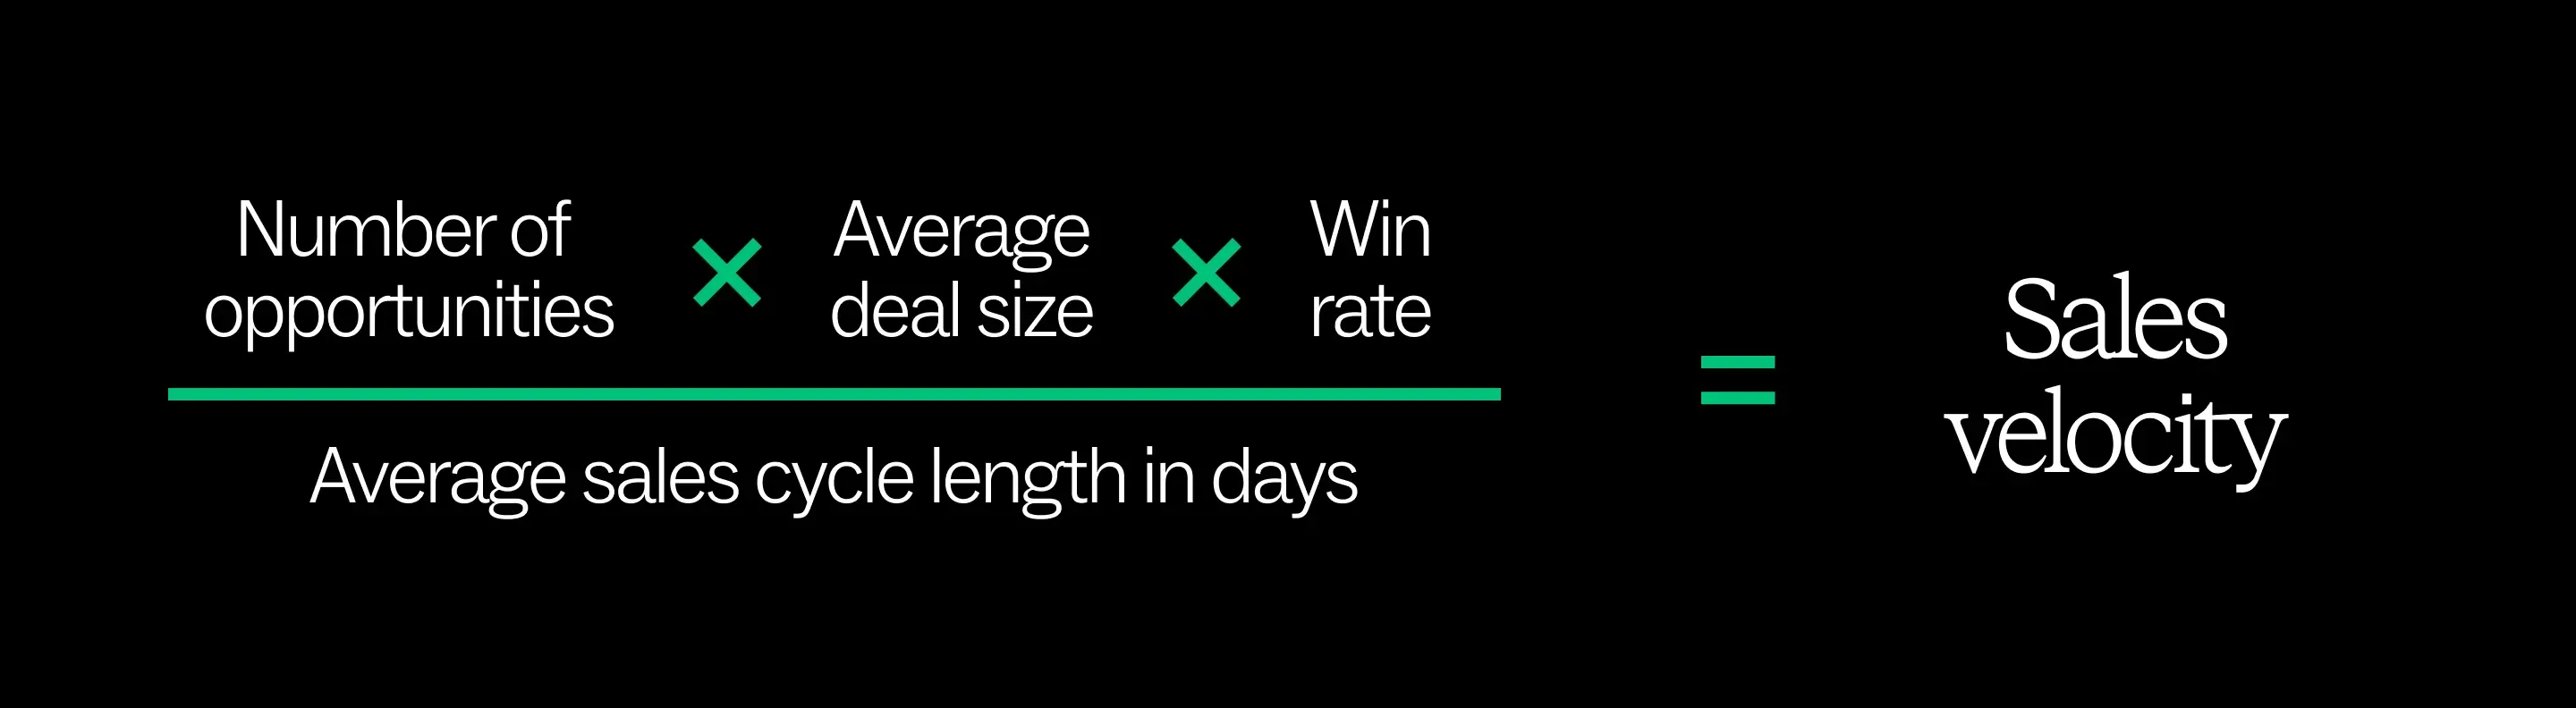
3. Sales velocity
Sales velocity is like a speedometer. It shows how fast you’re generating revenue, based on how many deals you have, their size, your win rate, and how long it takes to close.
If you have 20 deals at $5,000 each, a 25% win rate, and a 30-day sales cycle, your sales velocity is $833 per day. Faster cycles or bigger deals mean higher velocity.
Formula: (Number of opportunities × Average deal size × Win rate) / Average sales cycle length in days
If you notice this metric slowing down, check to see if it’s because deals are smaller, fewer, converting less, or just taking too long, and support your reps to act accordingly.
4. Win rate by rep (and stage)
Who is crushing it? Where are deals getting stuck? Look at win rates by individual rep and at each stage. If one team member is converting 75% of their proposals and another is at 35%, support lower performers with peer coaching, shadowing, or extra training.
Formula: (Won deals by rep or stage / Total deals worked by rep or stage) × 100

Tip: Help your reps drive up to 14% higher win rates with Mural. Try the Importance / Difficulty matrix template to map out team strategies based on stages, how well approaches are working, and ease to complete. Have your most successful reps share out their best tips and approaches in collaborative learning sessions, which can be powerful for encouraging teamwork.
Related: How to enable sales teams with product knowledge
5. Average deal size
What is the average amount of money you bring in with a closed deal? If you closed 10 deals worth $200,000, your average deal size is $20,000. If this number goes up or down, check if you’re landing the right kind of business or whether you need to prioritize upselling.
Formula: Total closed-won deal value / Number of closed-won deals

{{talk-to-sales-demo="/cta-components"}}
6. Sales stage duration
This metric tracks how long deals spend at each stage. If one stage is taking twice as long as the others (e.g. “proposal sent” lasts 14 days while the rest are 7), you know where to focus on removing blockers or speeding things up. Get your cycles shorter by streamlining slow steps.
Formula: Total days all deals spent in stage / Number of deals in that stage

Tip: Try creating a process map in Mural. Ask your team to flag slow stages and contribute their ideas with sticky notes or comments.
Related: A complete guide to sales process mapping
7. Lead-to-opportunity conversion rate
How many of your leads become real opportunities? If you’re converting 500 leads into 40 opportunities, that’s 8%. A low number means you need to improve lead quality or improve your qualification process to avoid wasting marketing and sales team time.
Formula: (number of opportunities created / number of leads) × 100

8. Deal age
Deal age is just how it sounds: How long has a deal been sitting in your pipeline? If you see a bunch of deals stuck for over 60 days, help your reps reengage.
Formula: Current date - deal creation date

Tip: Build a mural to review aging deals as a team, and make decisions together. Use the kanban-style now, next, later template to move deals to different categories based on age.
9. Lead quality metrics
Score your leads based on criteria like ideal customer fit and engagement to help your team focus on those likely to close. A targeted approach saves time and increases your win rates. But make sure to regularly review and refine your scoring system to prioritize the top opportunities.
Tip: Create a customer scoring formula that you refine over time based on results. Mural’s bull’s-eye diagram is a fantastic template to visually rank quality leads.
10. Forecast accuracy over time
How close were you with your sales forecasting last quarter? This metric compares your prediction to what you closed. A 15% margin gives your team a bit of breathing room for natural fluctuations, without getting too far off track. Anything larger could signal issues with your data, your sales process, or changing market conditions.
Formula: [1 - (|Forecasted revenue - Actual Revenue| ÷ Actual Revenue)] × 100

Tip: Encourage team members to share ideas on why there were discrepancies, like unexpected customer behavior or process challenges. Encourage honest, open input by using Mural’s Private Mode and Voting features.
How Mural helps turn sales metrics into strategy
Track the right predictive sales pipeline metrics, and you can move beyond reactive selling. Make data-driven decisions throughout your sales process and focus your pipeline reviews on real opportunities.
Related: Document your sales process and improve team alignment
Automation across a sales organization can open up 20% more sales team capacity, according to McKinsey. Mural helps your team transform static pipeline reviews into interactive collaborations with an AI-powered, interactive workspace. Your go-to-market team can work together in real time, spotting risks, sharing insights, and aligning on immediate next steps to accelerate results.
For your next meeting or working session, try following visual collaboration habits with your sales team in Mural:
- Prepare for meetings and reviews with a Mural sales template
- Color-code deals by health (green = healthy, yellow = at risk, red = stuck)
- Tag opportunities that need action or leadership input with icons
- Add comments or sticky notes for coaching, deal strategy, or status updates
- Leverage Mural AI to organize customer insights to close deals, faster
When your team reviews the data together visually, you create ownership, transparency, and a proactive, data-driven culture. Gert-Jan shares the value of visual collaboration on his sales team:
"Mapping our deals in Mural makes it a lot easier to take action. We don’t just see the pipeline, we understand it."
Ready to get started? Chat with our sales team to learn more how visual collaboration can give your sales organization a competitive edge.
{{talk-to-sales-demo="/cta-components"}}


.webp)


