On this page
Use Data flow diagram template
Get started

Visualize data flows and behaviors to explain complex processes

Data flow diagrams (DFDs) are typically used by IT and engineering teams to show the flow of information, source of data inputs, and how that data is stored. Since 66% of knowledge workers aren’t very happy with how their team works together, these visual representations of a system are used to explain complex processes to key stakeholders or to build out new structures with your team.
Data flow diagrams visualize relationships between external entities, processes, data stores, and data flows. You can visualize data flows with both parallel and asynchronous behaviors using our data flow diagram template. This allows engineering and IT teams to collaborate better with their teams — something most workers want — and produce better results.
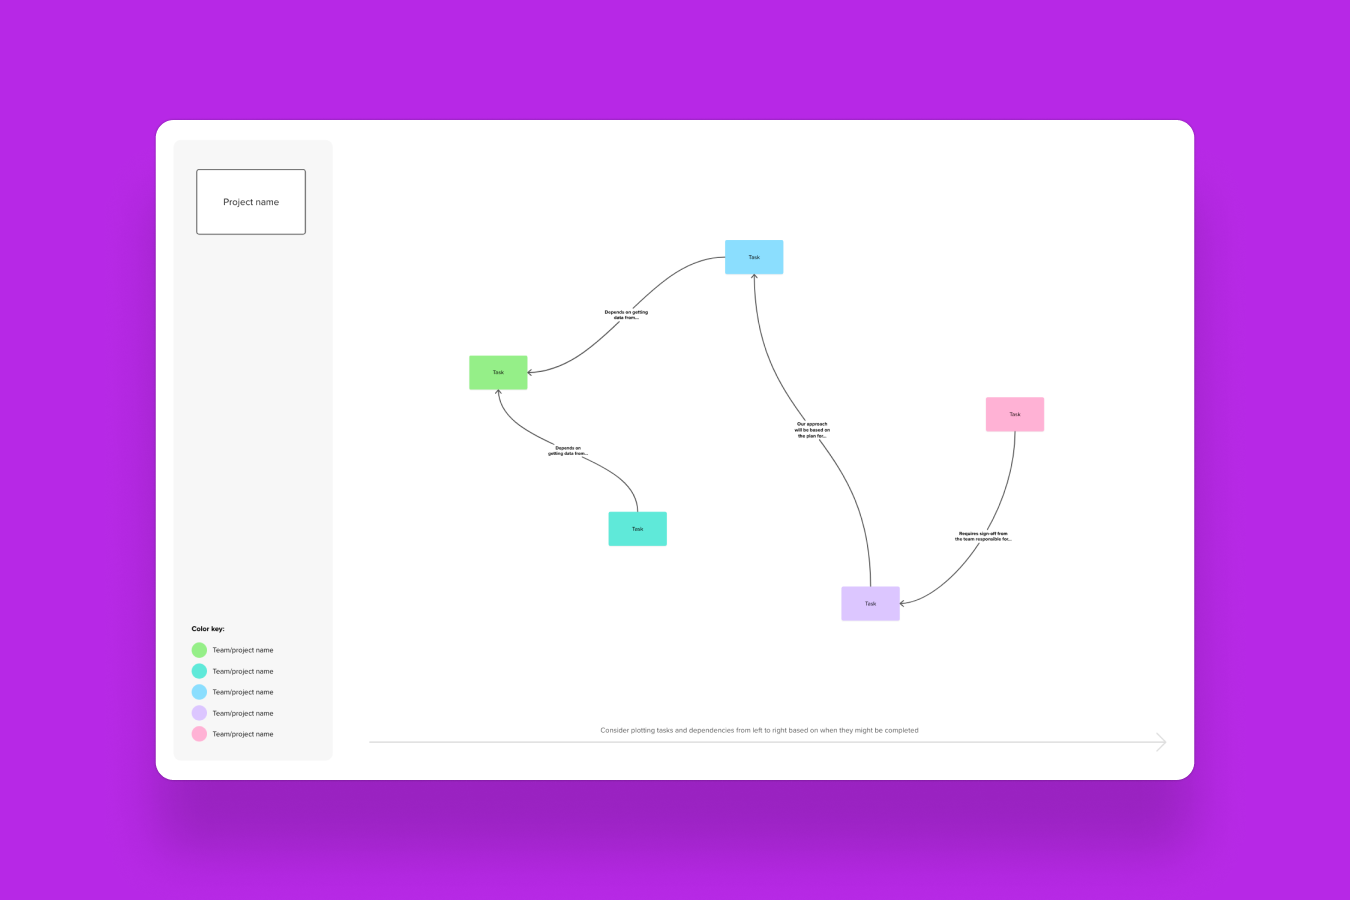
A Data Flow Diagram (DFD) visually represents how data moves through a system. It typically includes:
DFDs can have multiple levels, from the broad context diagram showing the entire system to more detailed Level 1, Level 2 diagrams breaking down processes further.
To use Mural’s data flow diagram template, follow the steps outlined below with your team.
The first stage in creating your diagram is to clearly define the data flow you’re going to focus on — this should be no longer than a phrase or one sentence.
Next, create a key that will make your diagram immediately clear to stakeholders. Use color-coded sticky notes, shapes, or icons to visually define data, processes, and external entities.
Using the key, visualize your data flow by using connectors to show the relationships between each of the components of your diagram. If you have multiple data flows to map, take advantage of Mural’s infinite canvas to expand your mural to reflect all your processes.

To get the most out of Mural’s data flow diagram template, you should:
Mural’s data flow diagram (DFD) template is a powerful tool for visualizing how data moves through a system, making it easy to map processes, identify bottlenecks, and improve workflows. Using Mural's template allows you to collaborate in real time with team members, making it ideal for group brainstorming, system design, and process analysis. Its intuitive, user-friendly interface enables both technical and non-technical users to create clear, actionable diagrams without the need for complex design software.
Mural's template simplifies complex ideas, helping you clearly communicate system architecture to stakeholders, developers, and business leaders. It fosters effective collaboration, streamlines problem-solving, and aids in the planning and documentation of business processes, ensuring everyone is aligned and on the same page.
Mural’s DFD template includes the essential elements needed to build a data flow diagram:
External entities – Represented by rectangles, these show where data originates or is sent outside the system (e.g., users, external systems).
Processes – Represented by circles or ovals, these show how data is processed within the system.
Data stores – Represented by open-ended rectangles, these indicate where data is stored within the system, such as databases or file systems.
Data flows – Arrows that connect processes, data stores, and external entities, showing the direction of data movement.
Pre-built templates – Ready-to-use sections and components for each part of the DFD, making it easy to get started.
Collaboration tools – Tools for team collaboration, such as sticky notes, comments, and real-time editing, ensuring easy communication during diagram creation.
This template provides an intuitive, visual approach to creating DFDs, which can help teams understand and improve system designs, workflows, or business processes.
Short answer, yes. Mural offers a limited free plan, but access to the full range of features, including the DFD template, generally requires a paid subscription. The free plan may allow access to basic templates and collaboration features, but for more advanced capabilities, integrations, and extensive use, a paid plan is necessary. You can check Mural's website for the most up-to-date information on pricing and available features for free and premium plans.
No credit card required